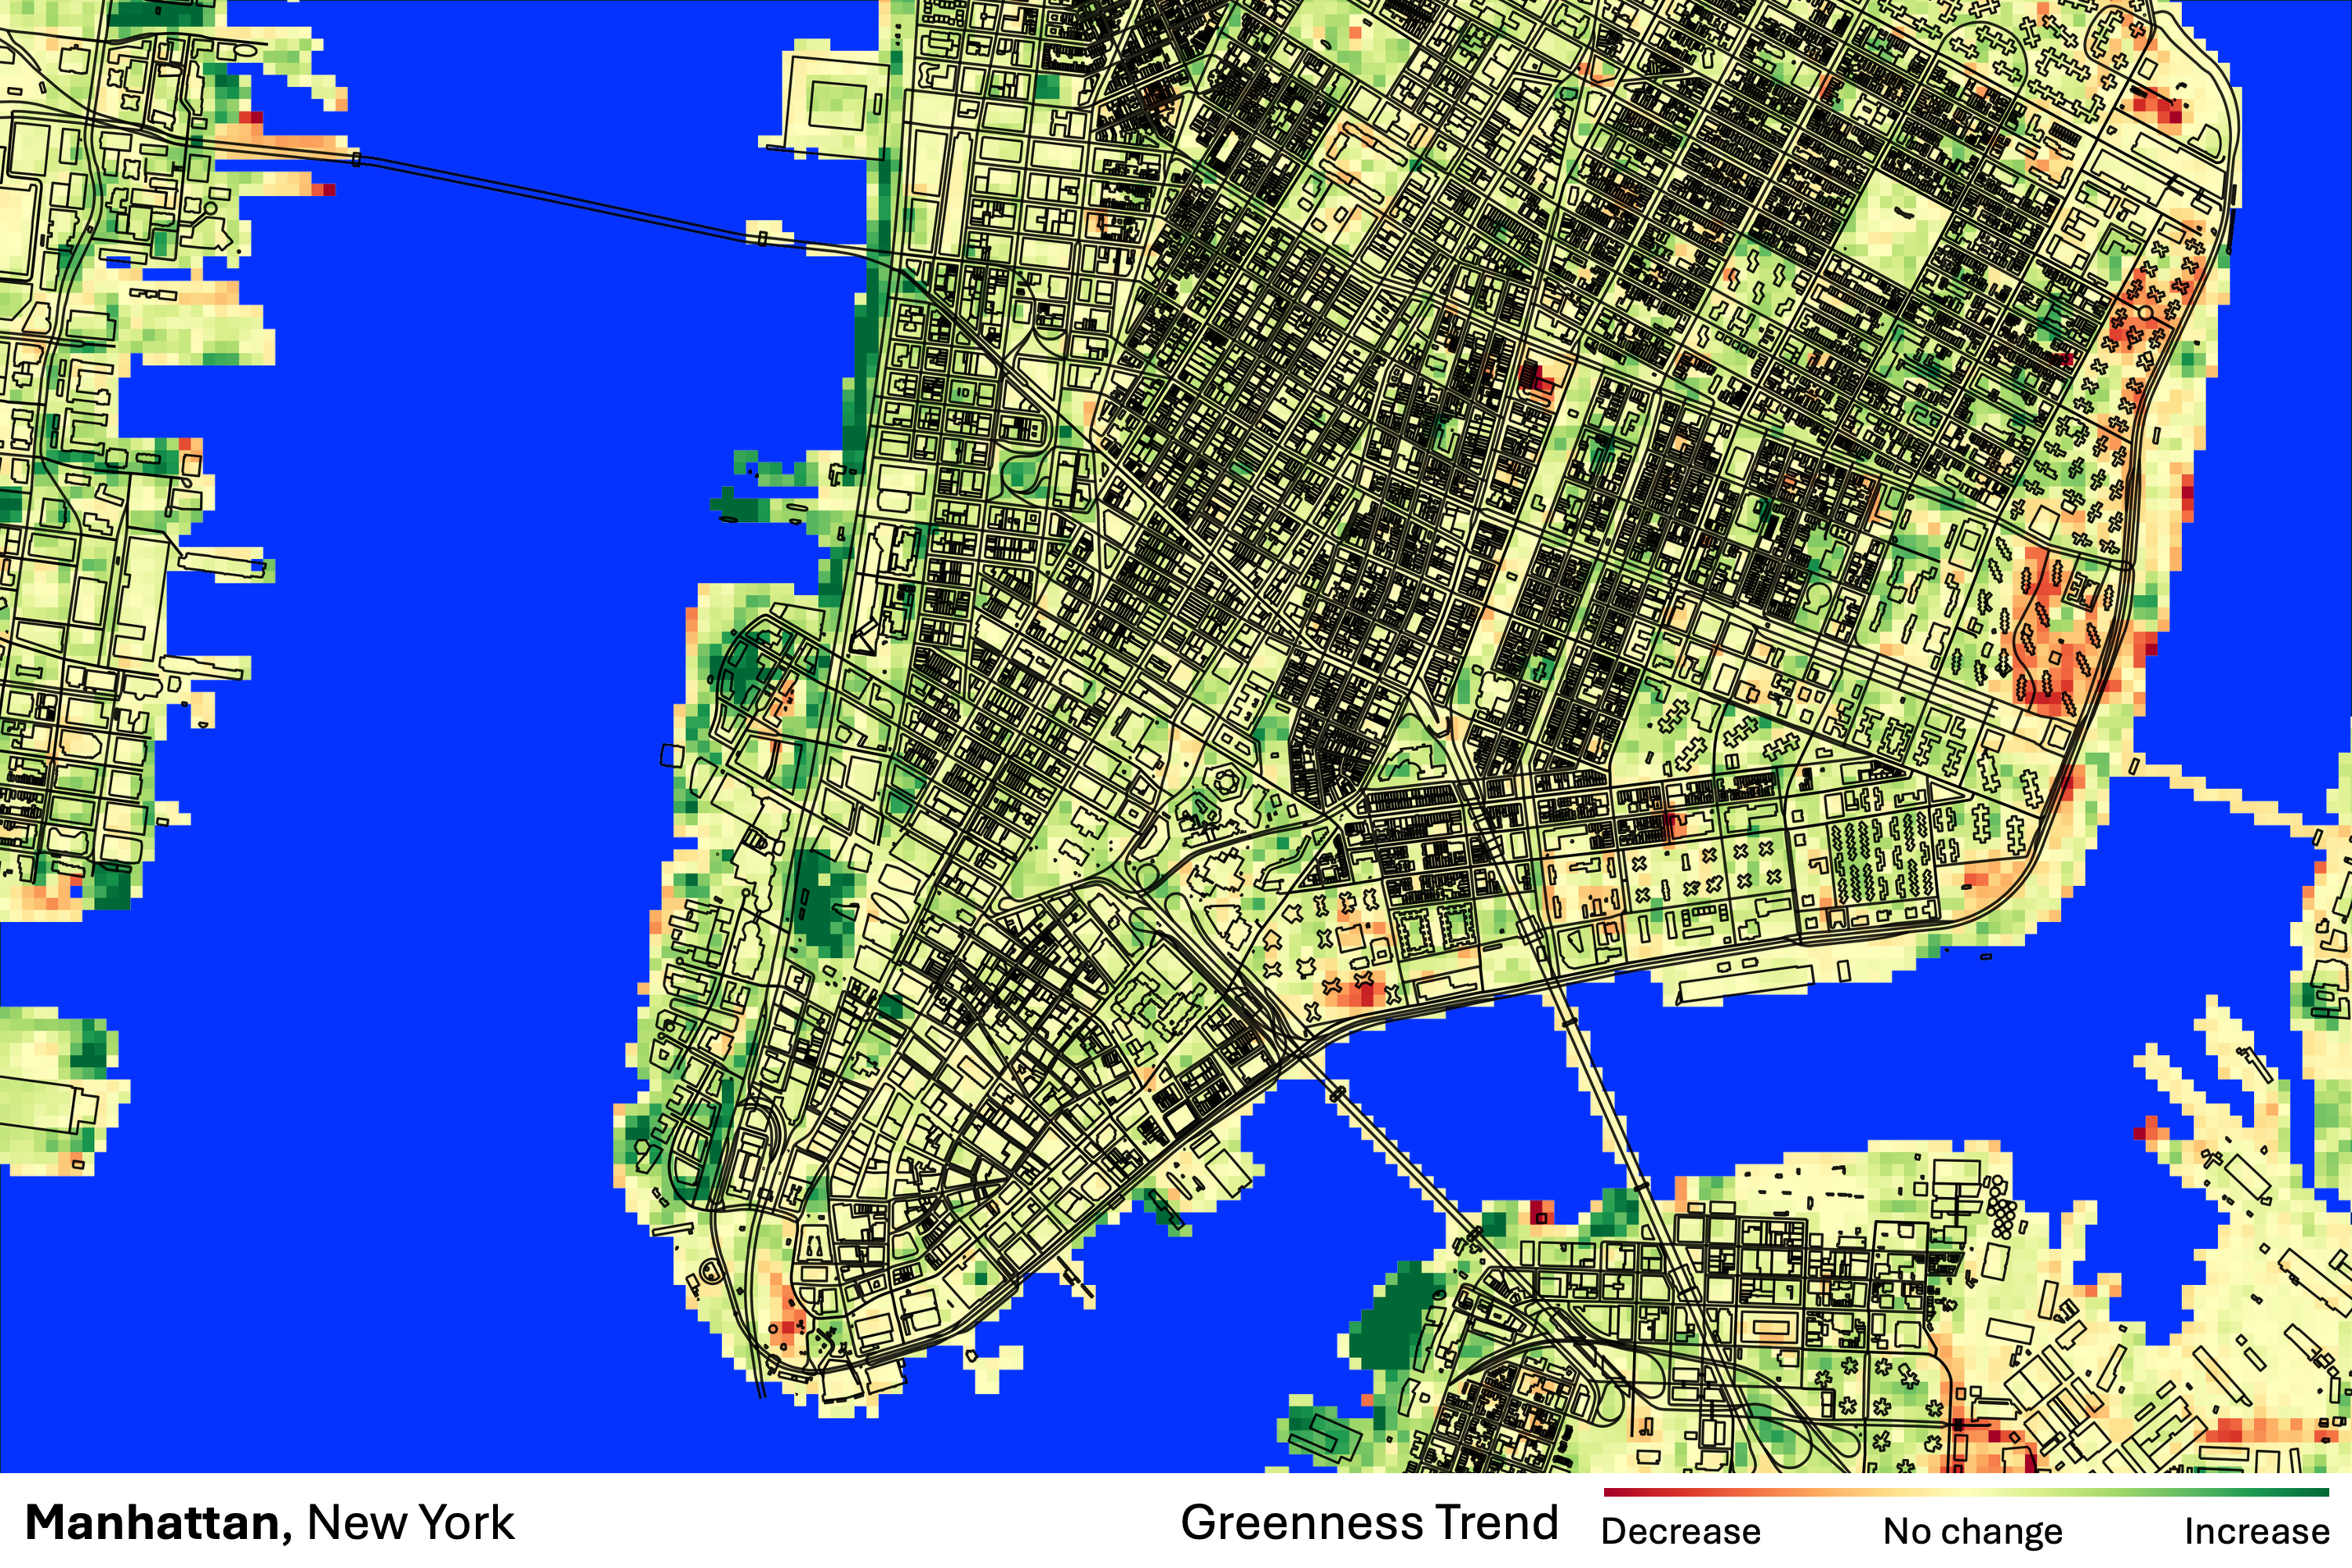
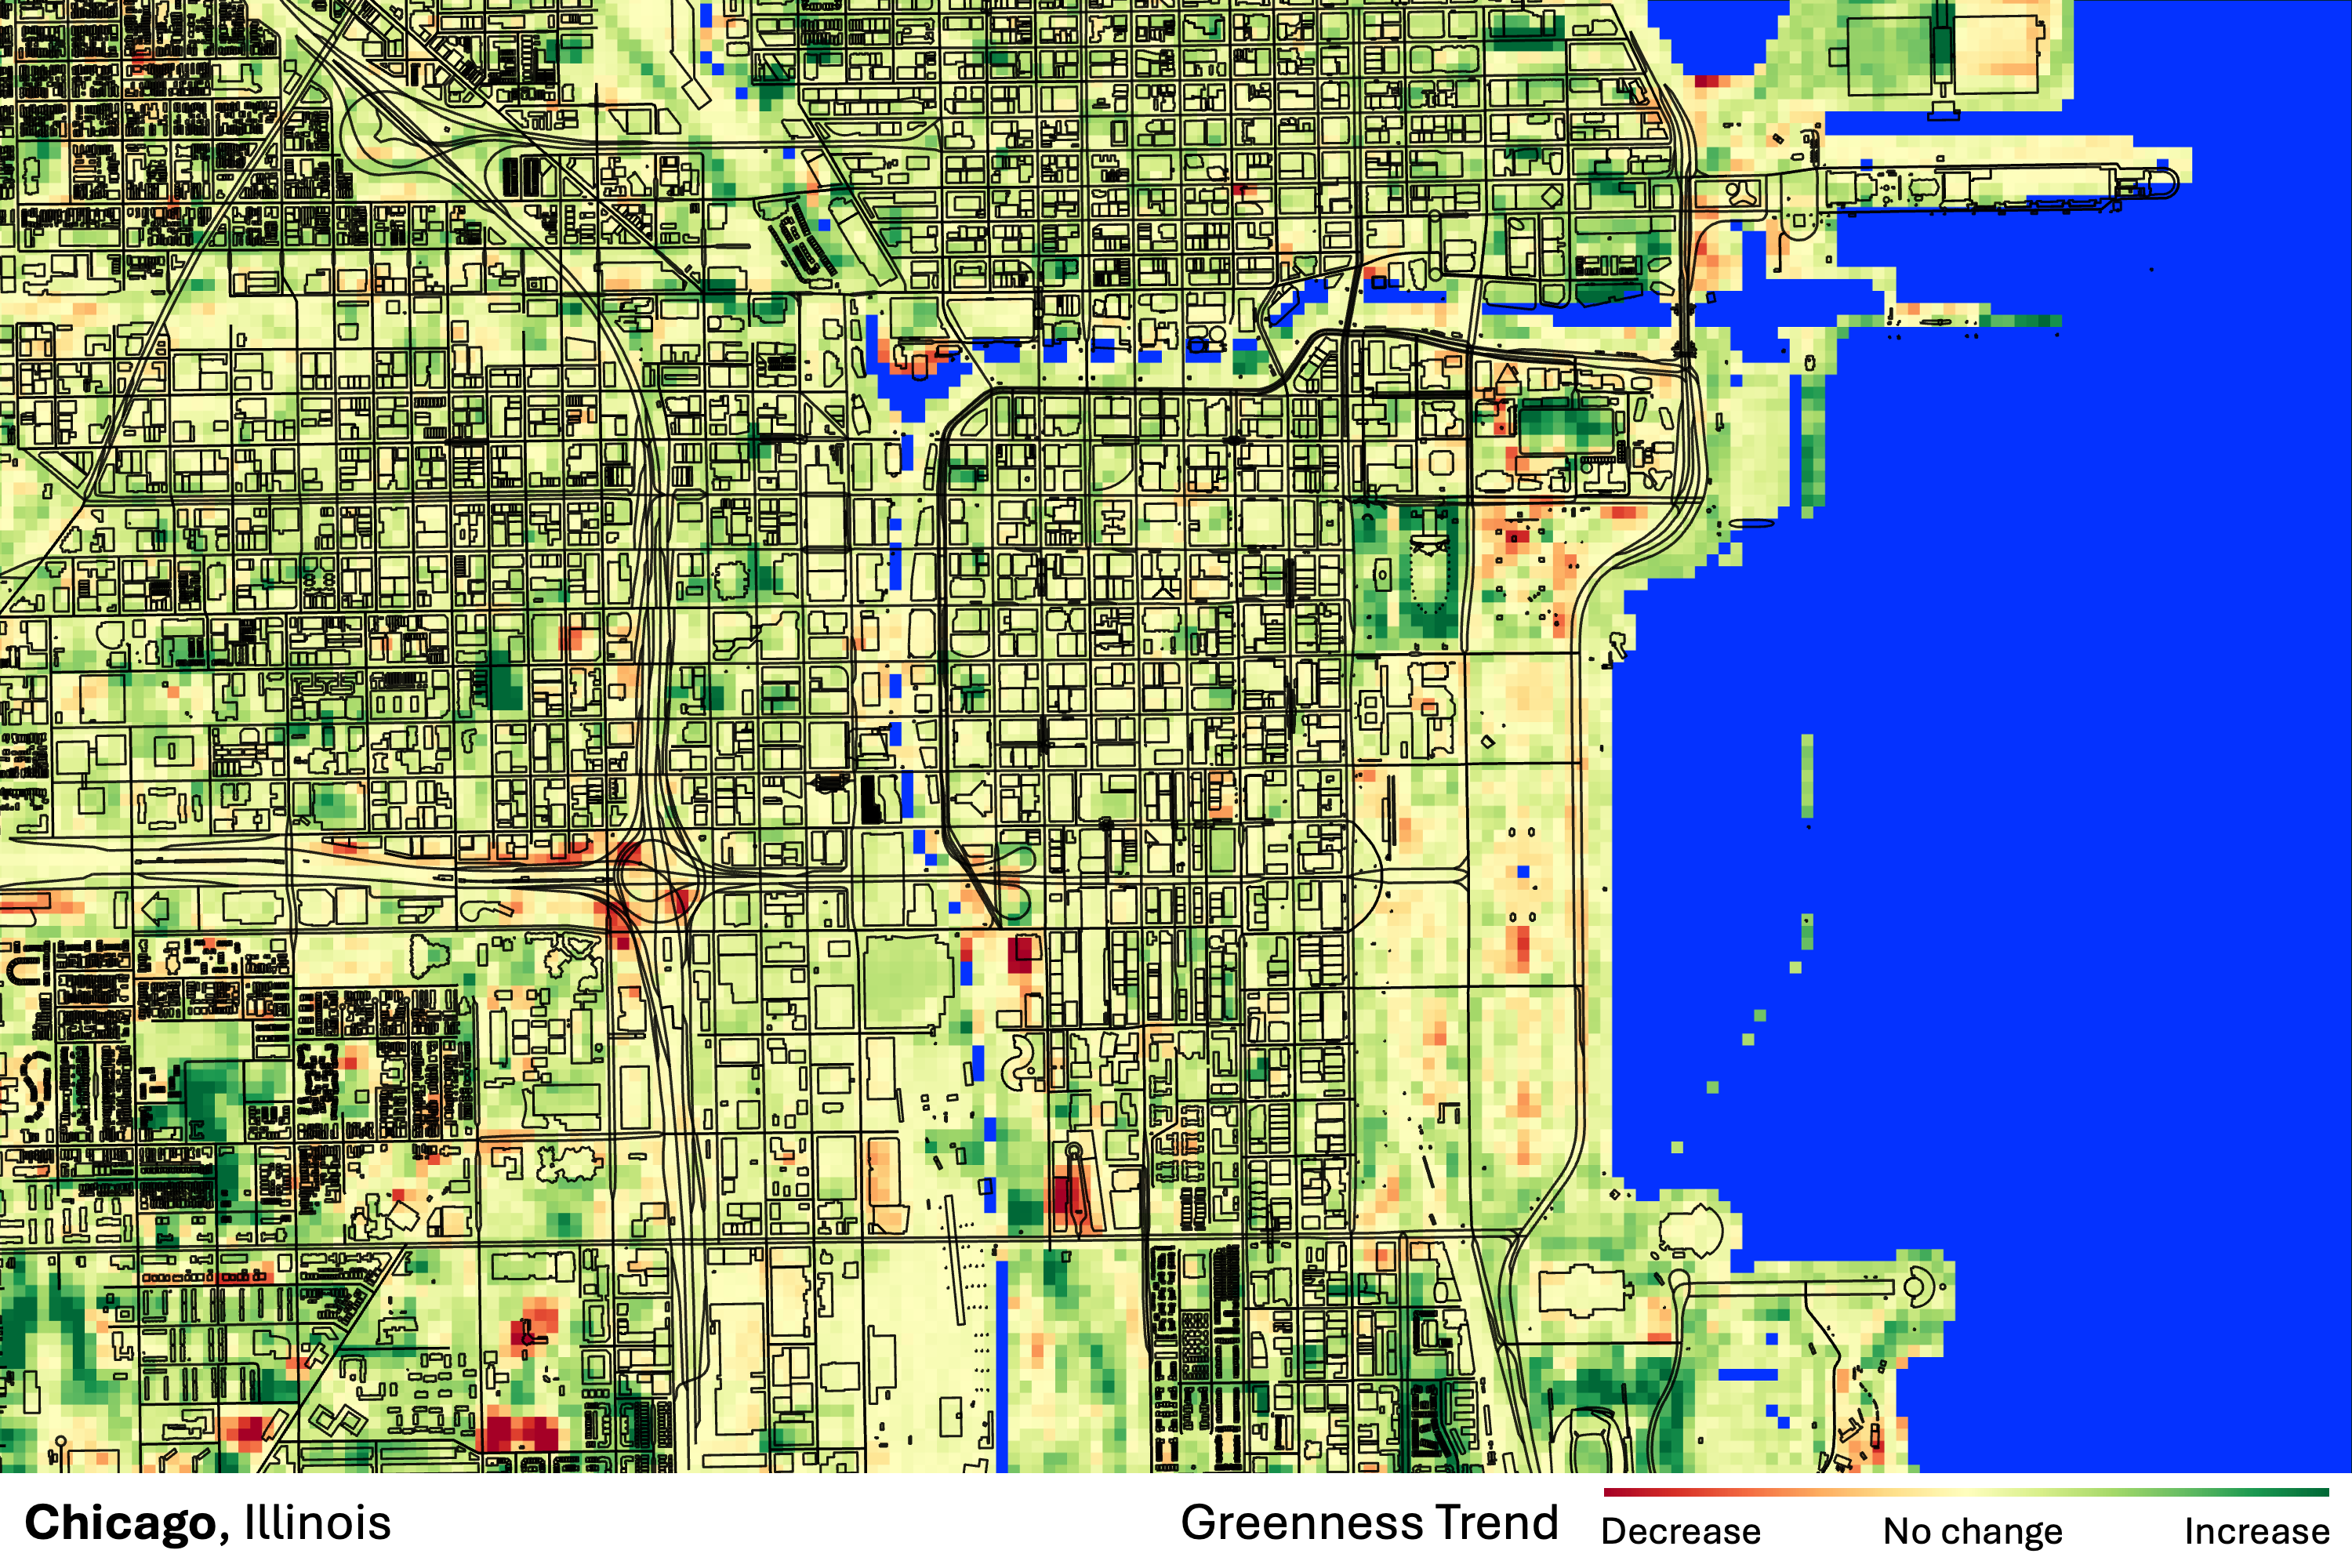
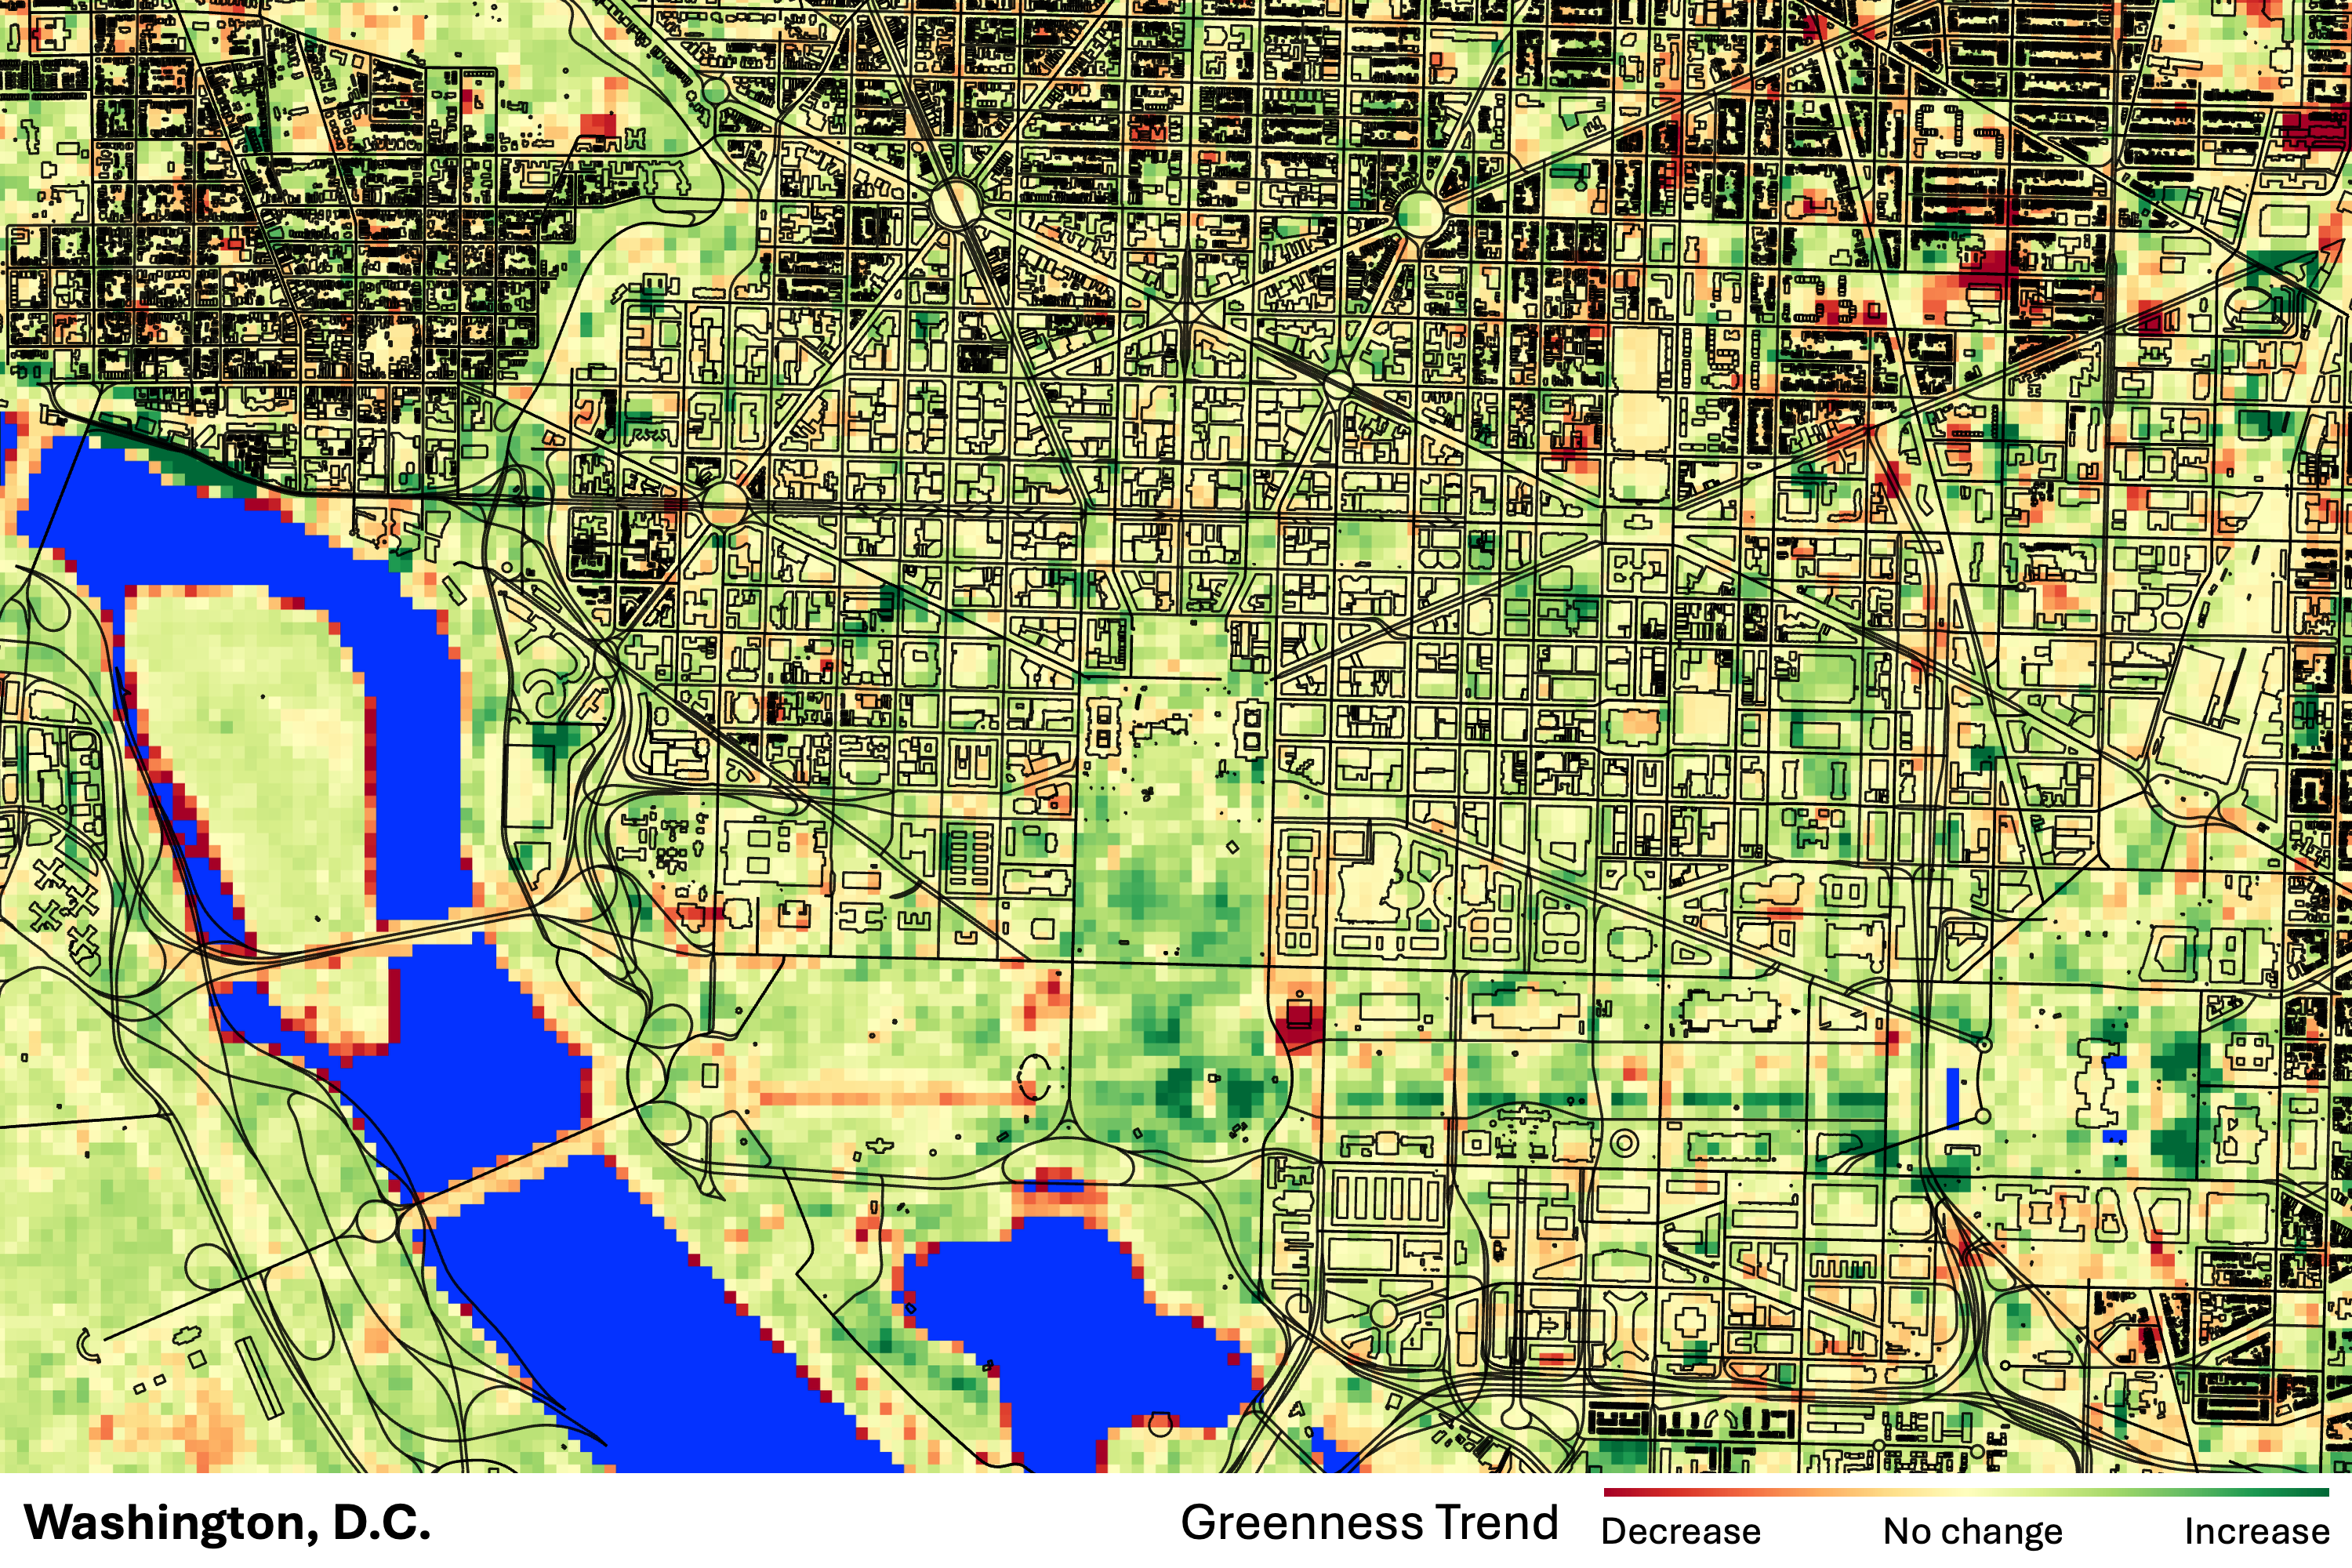
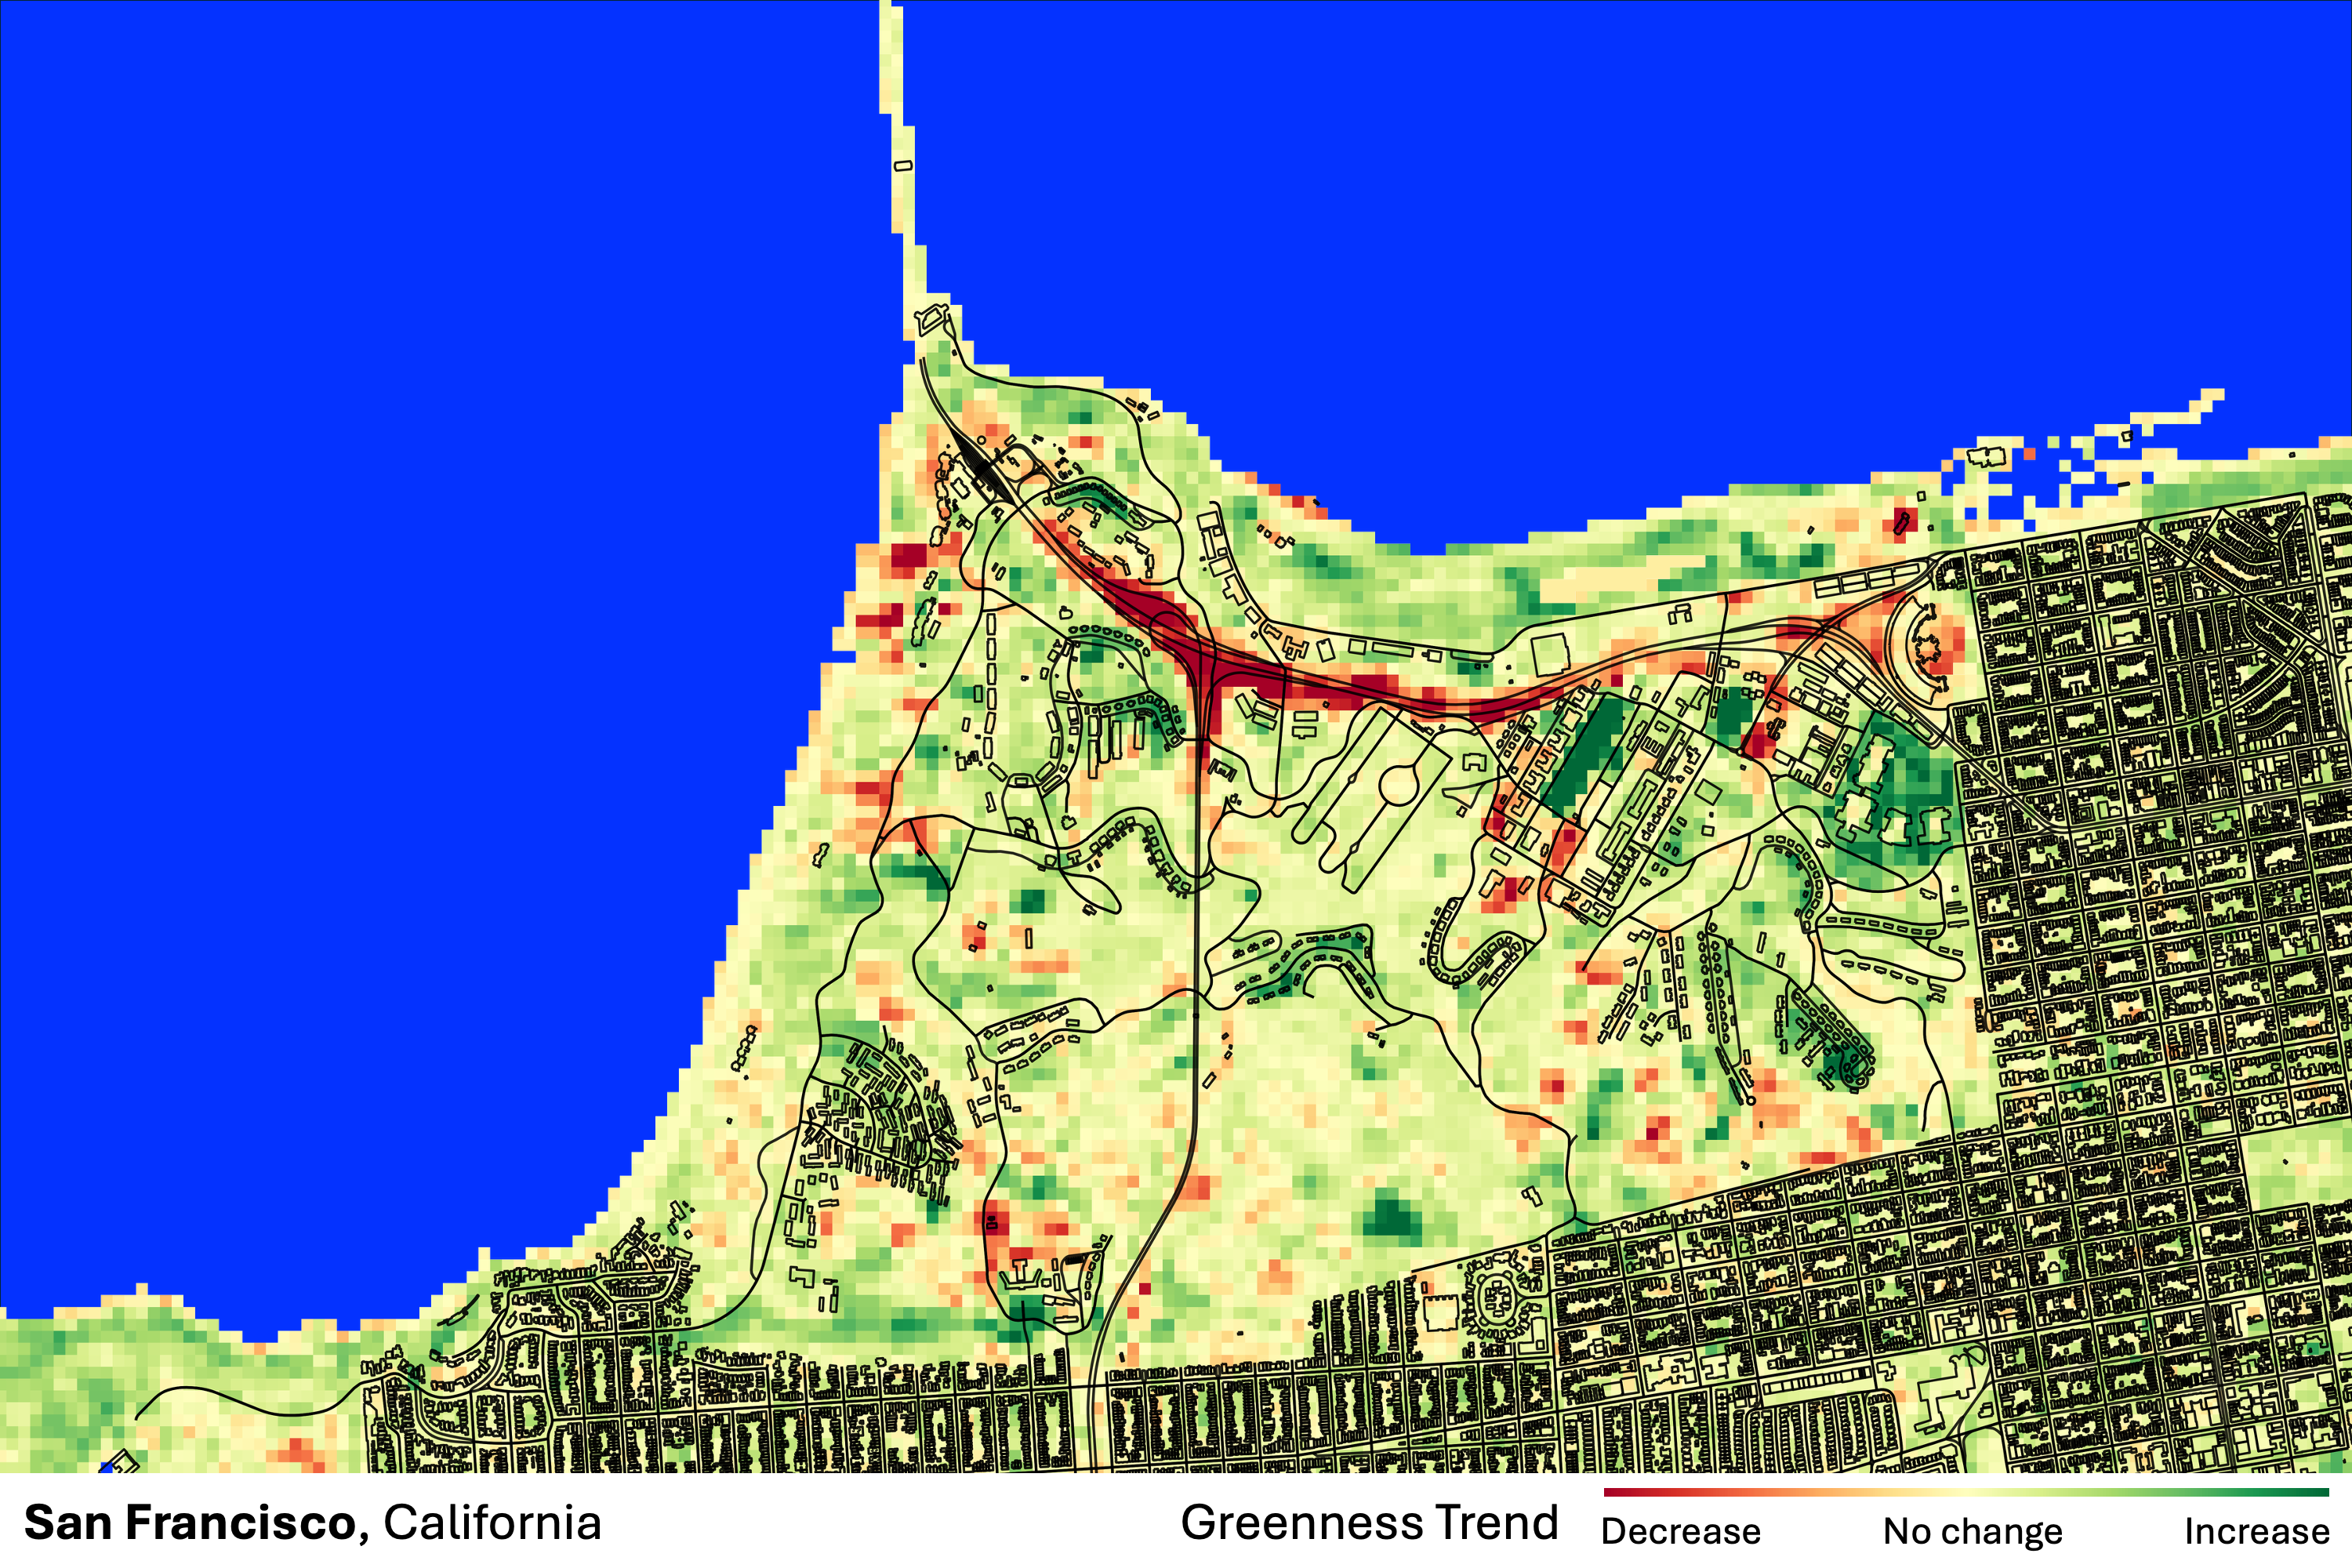
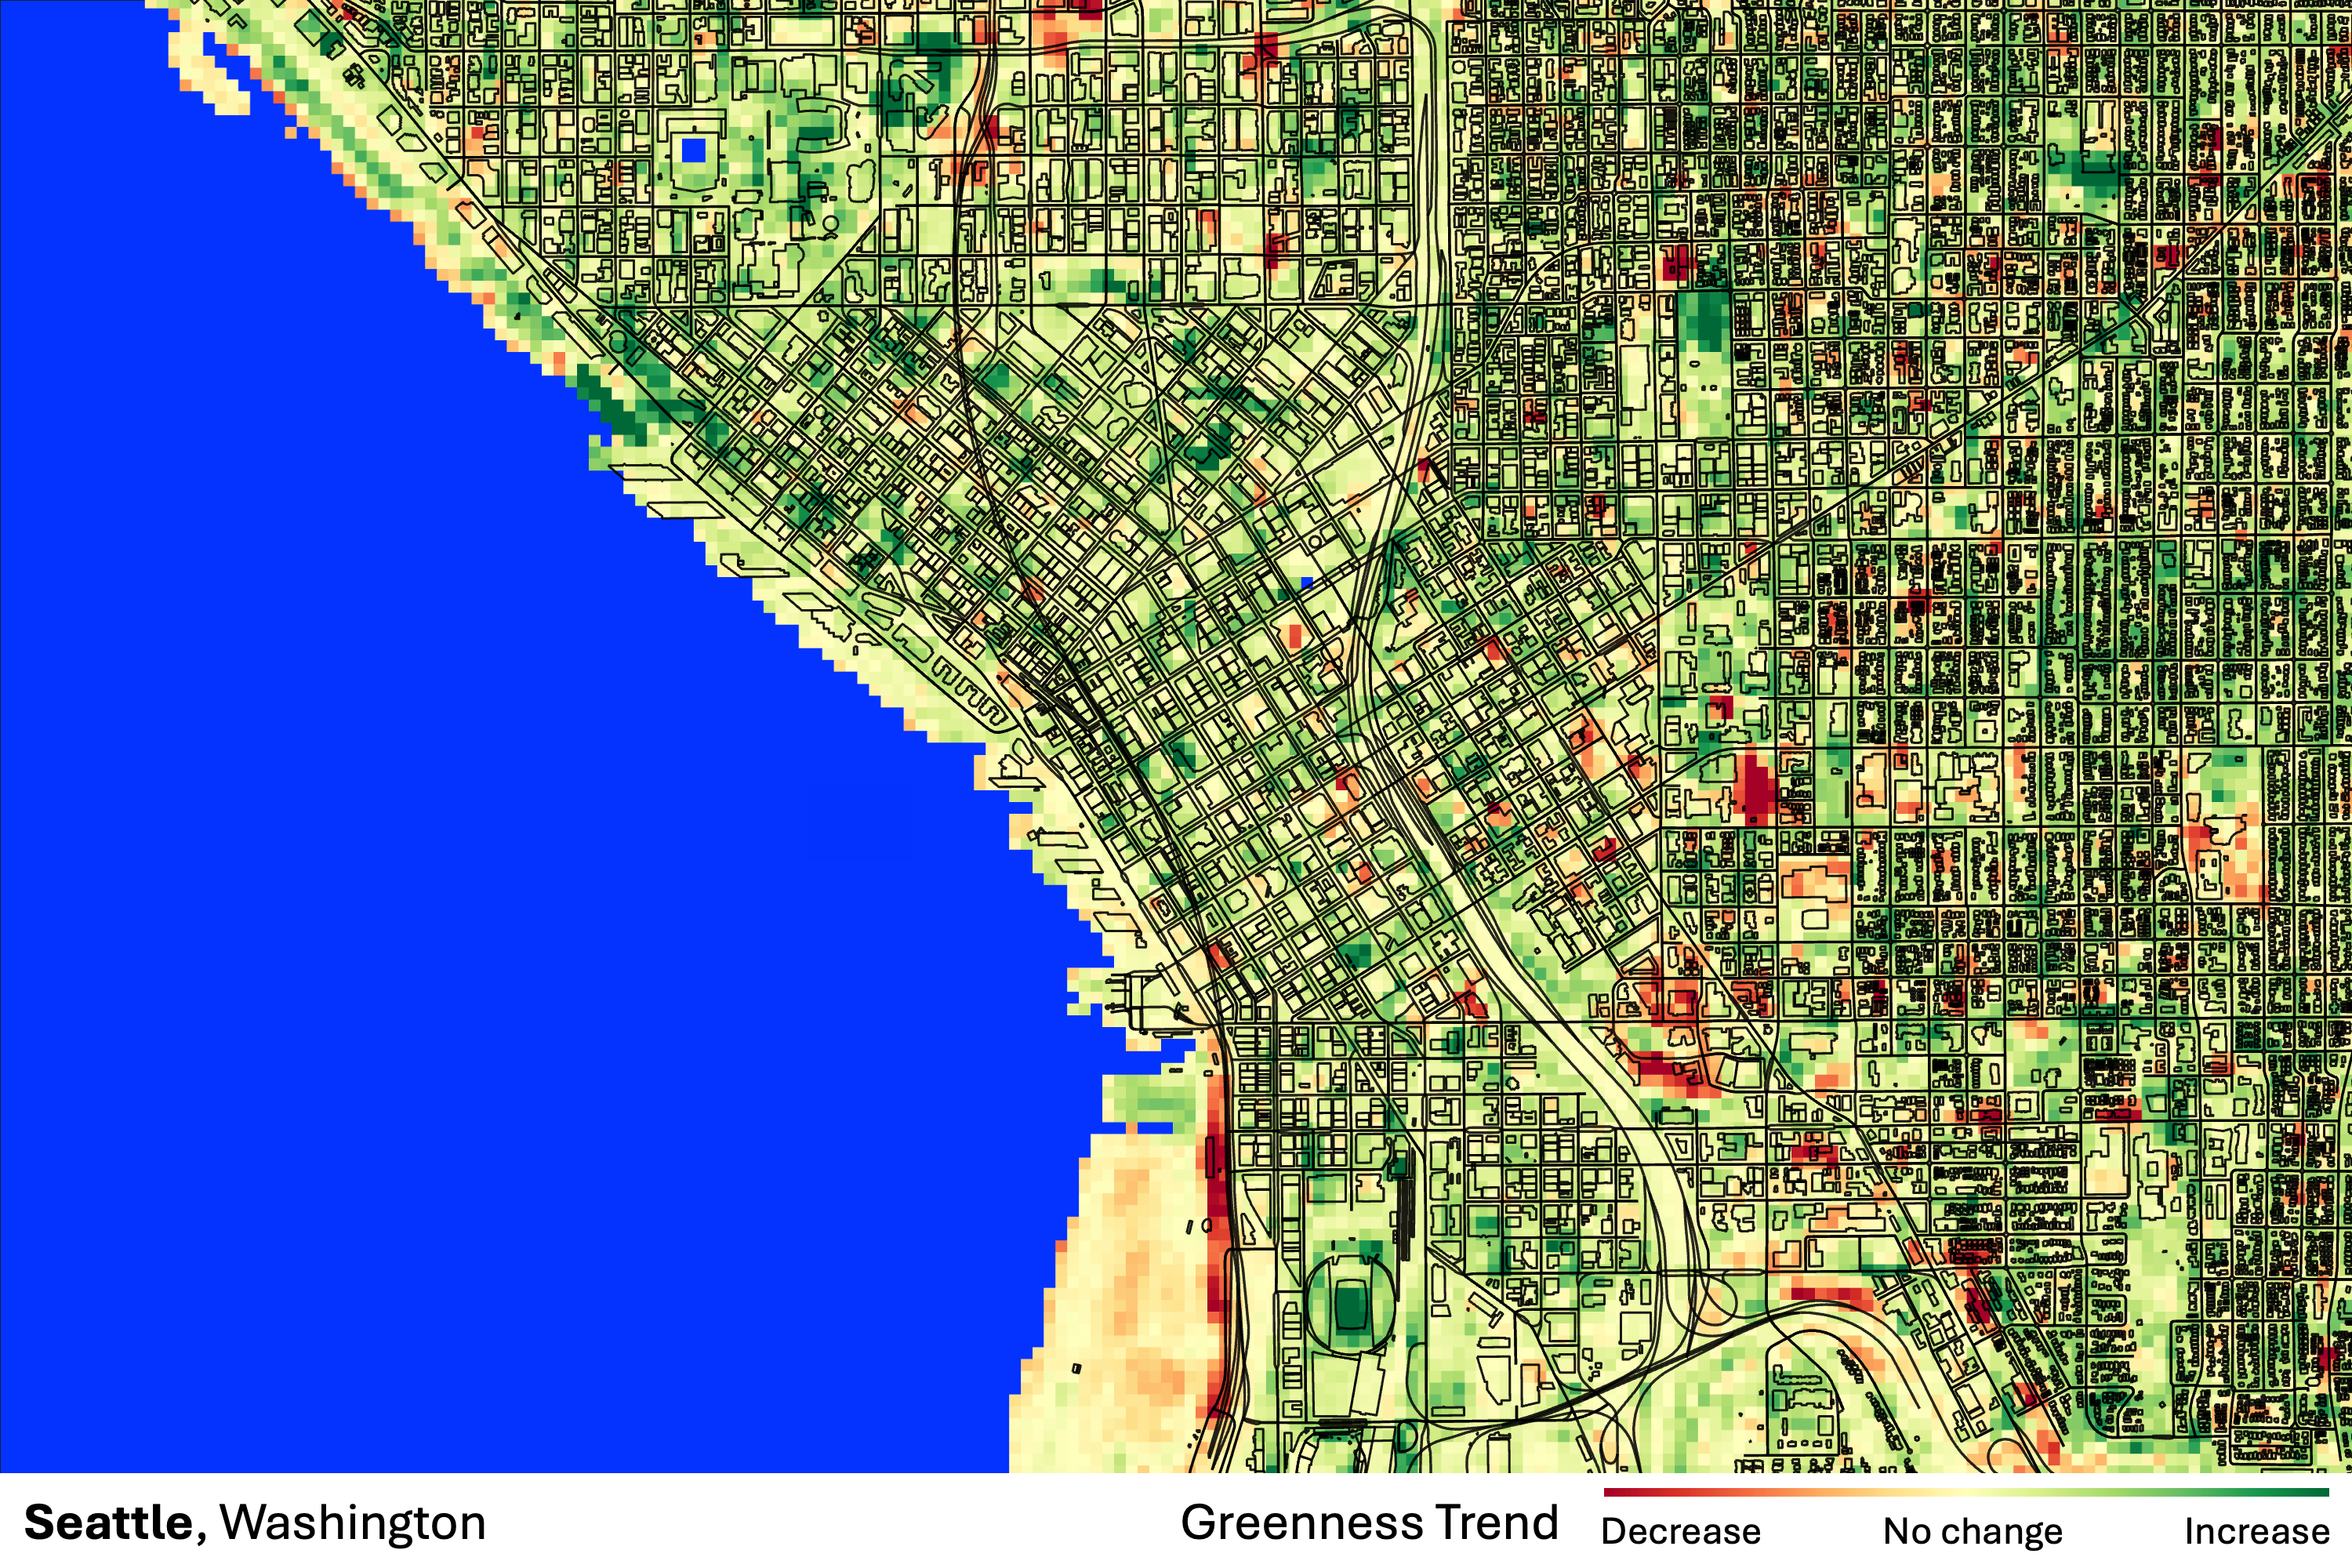
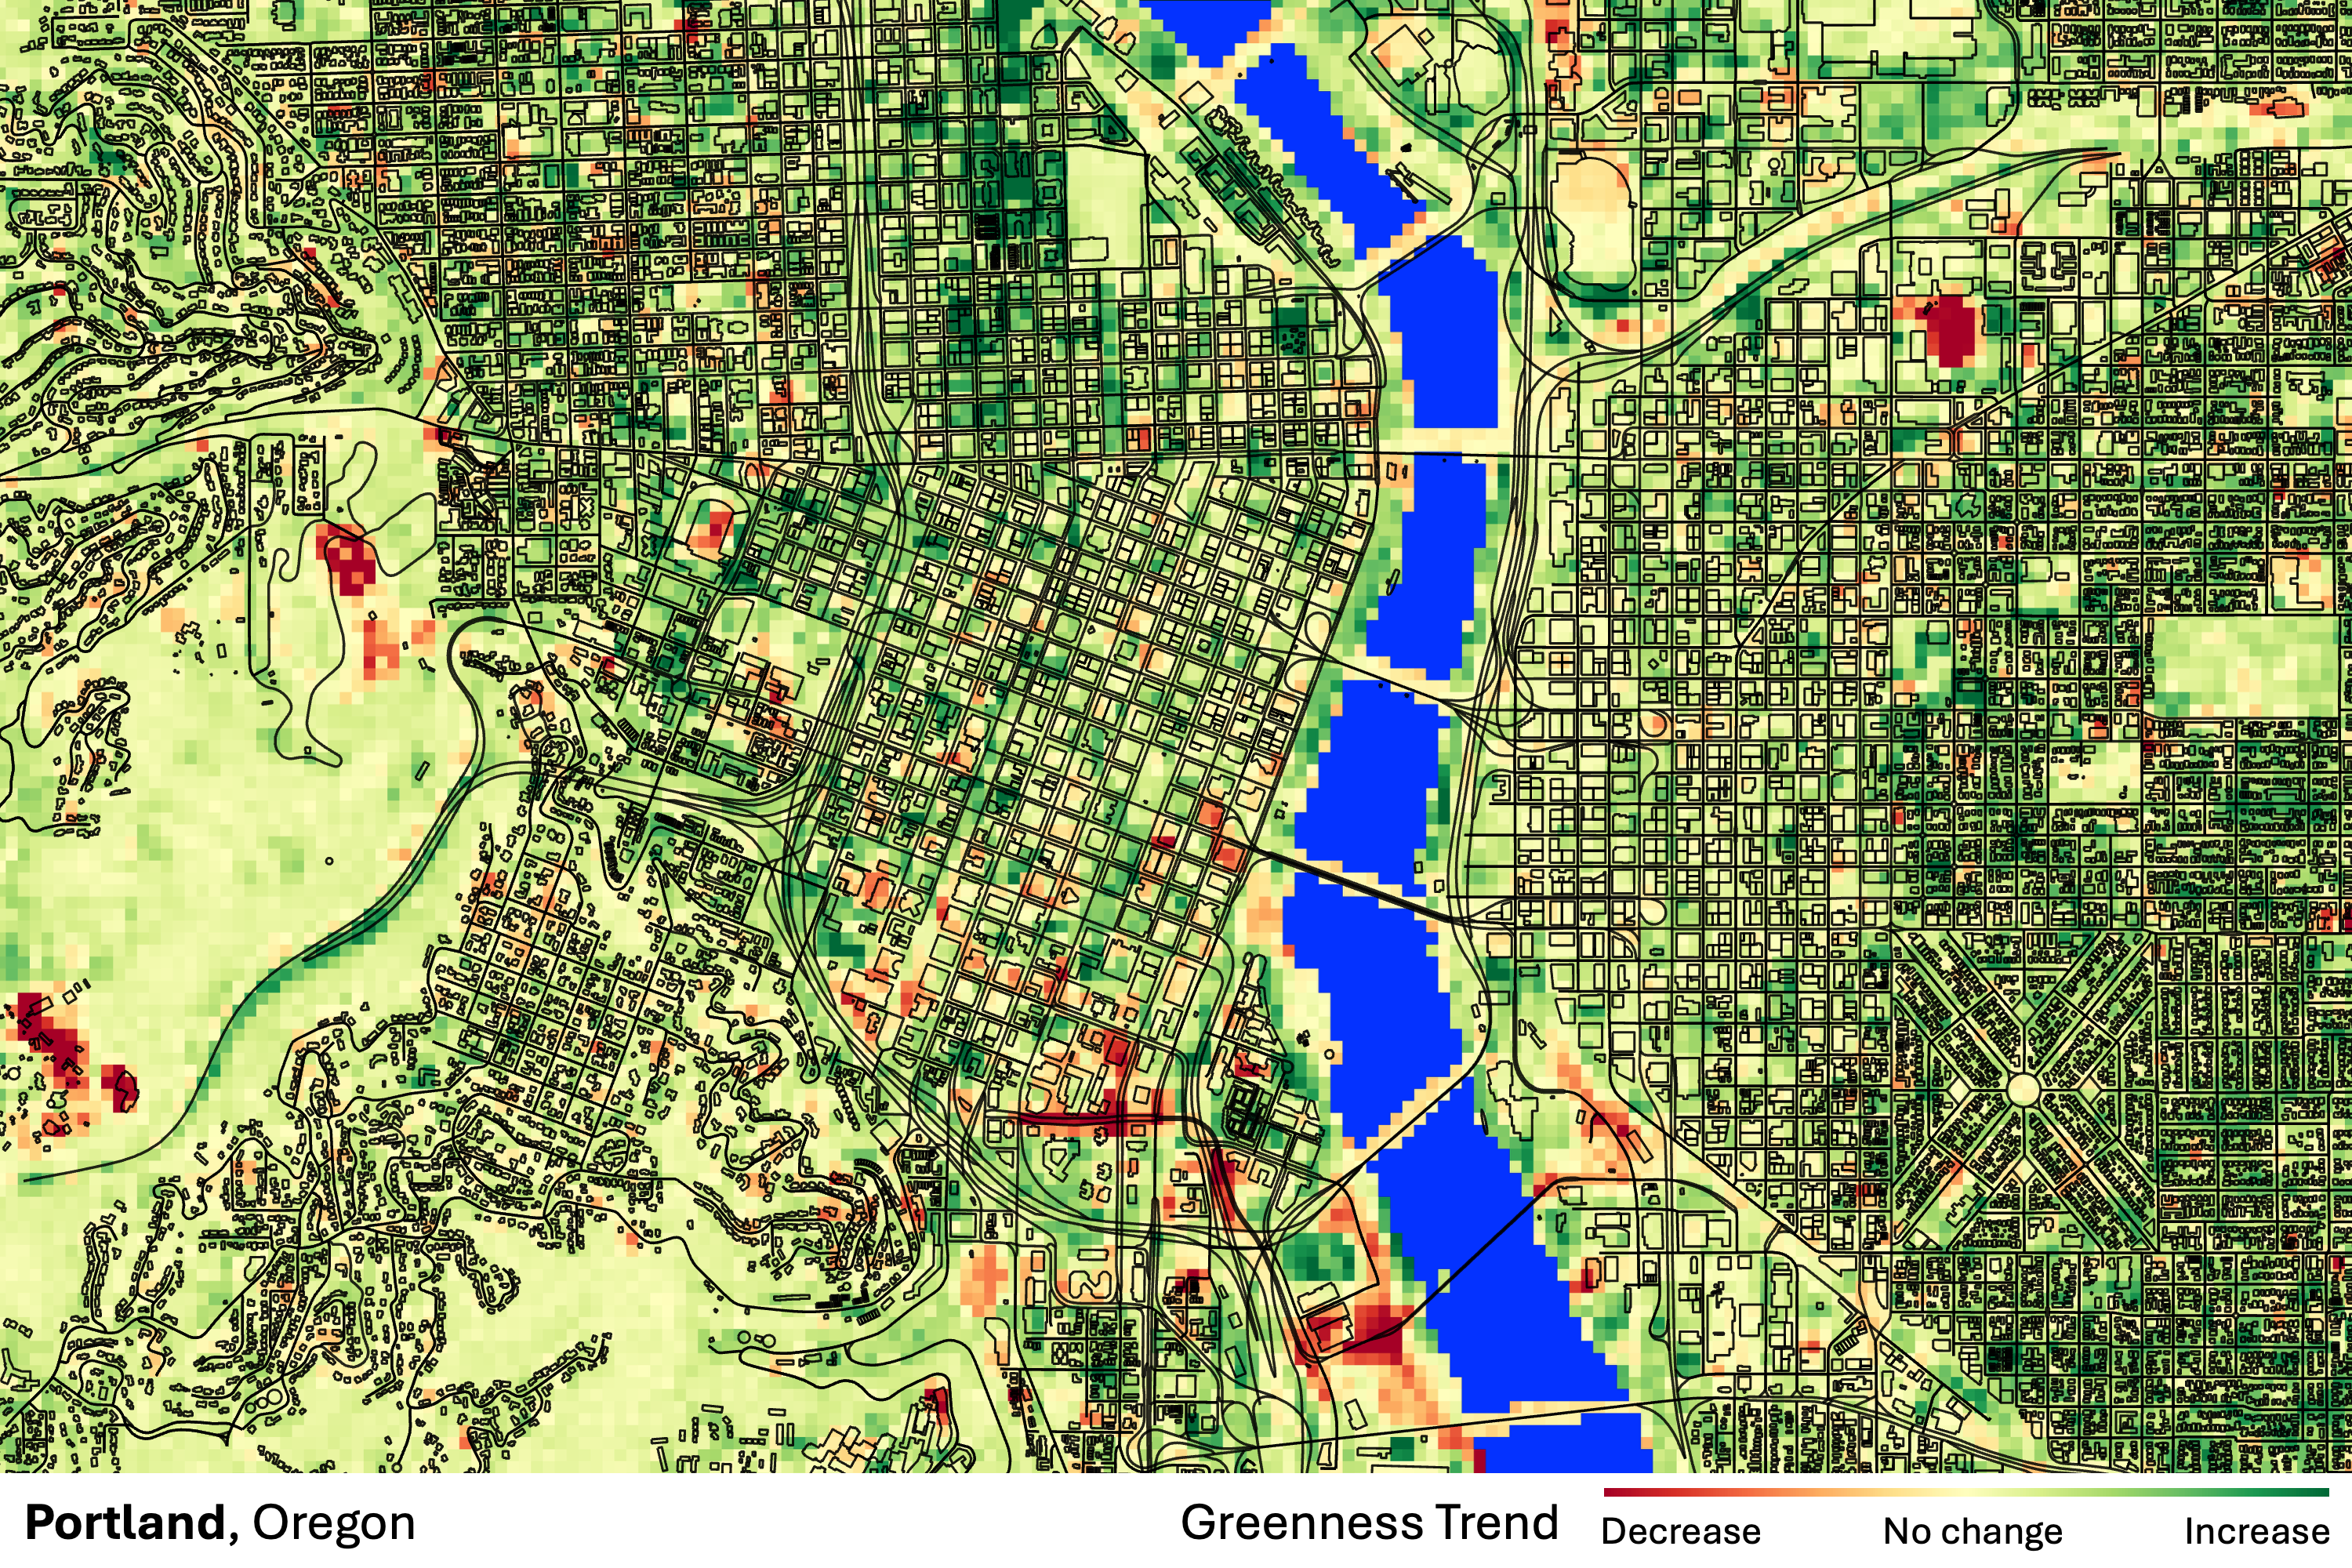
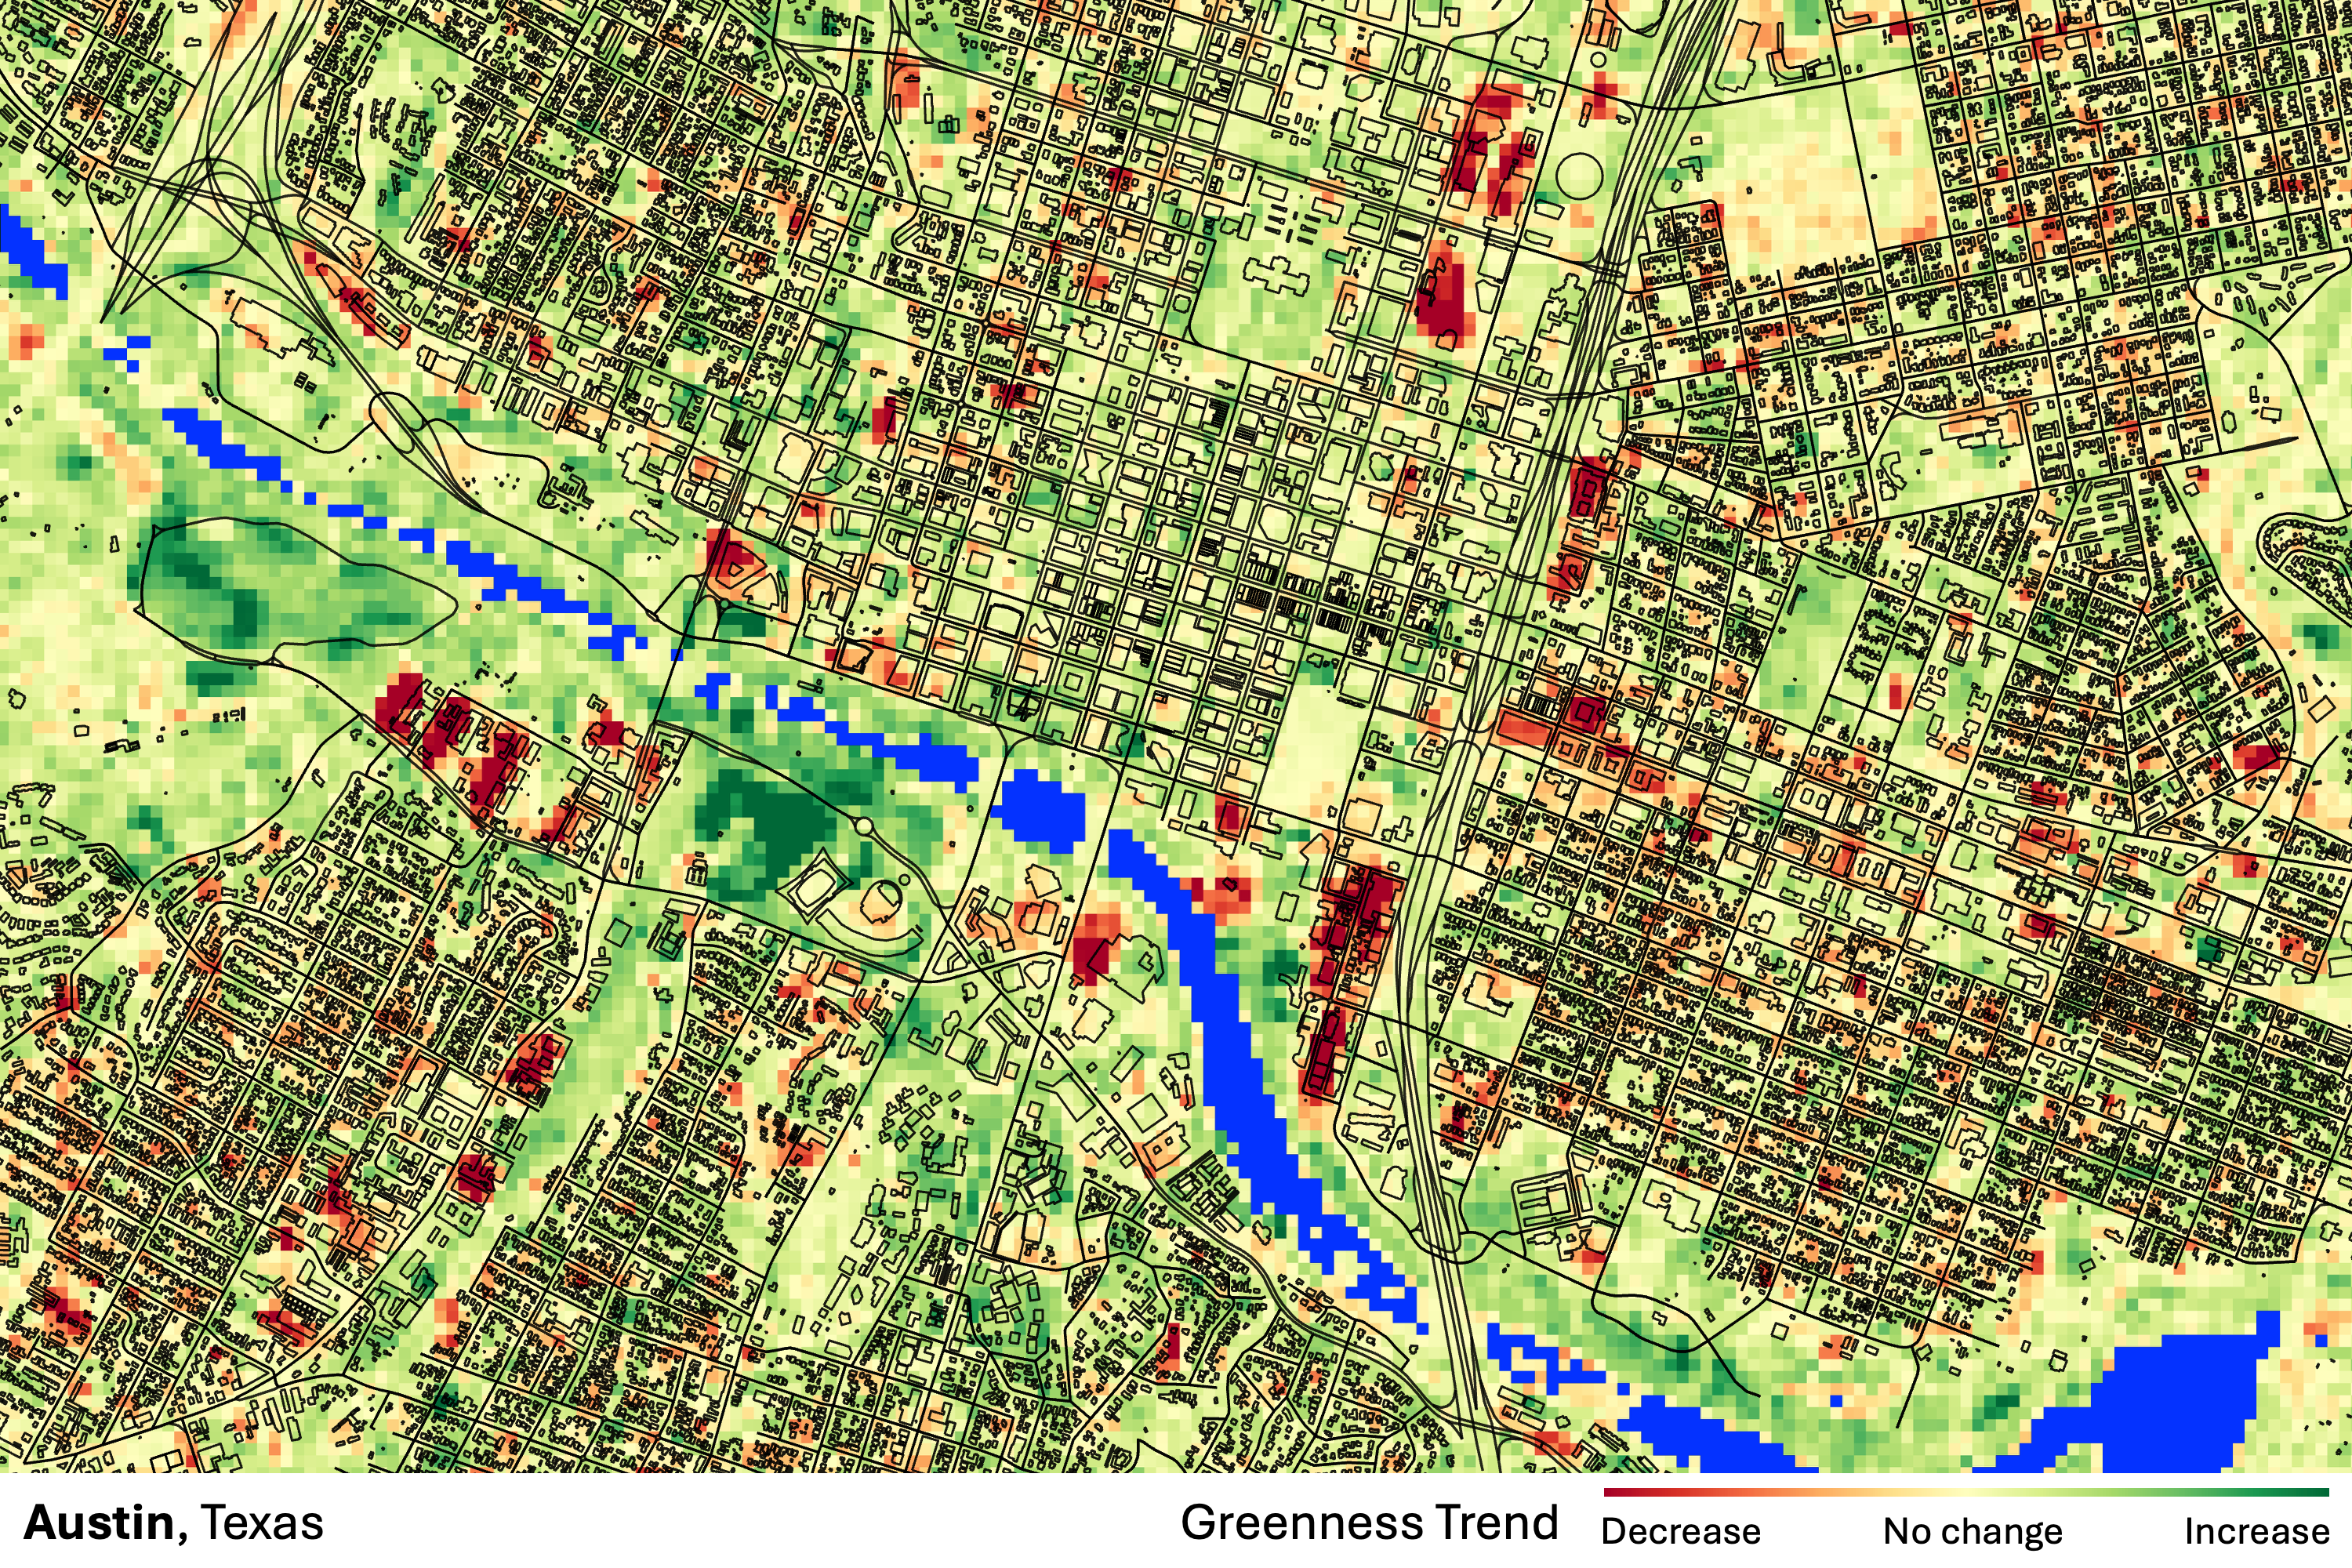
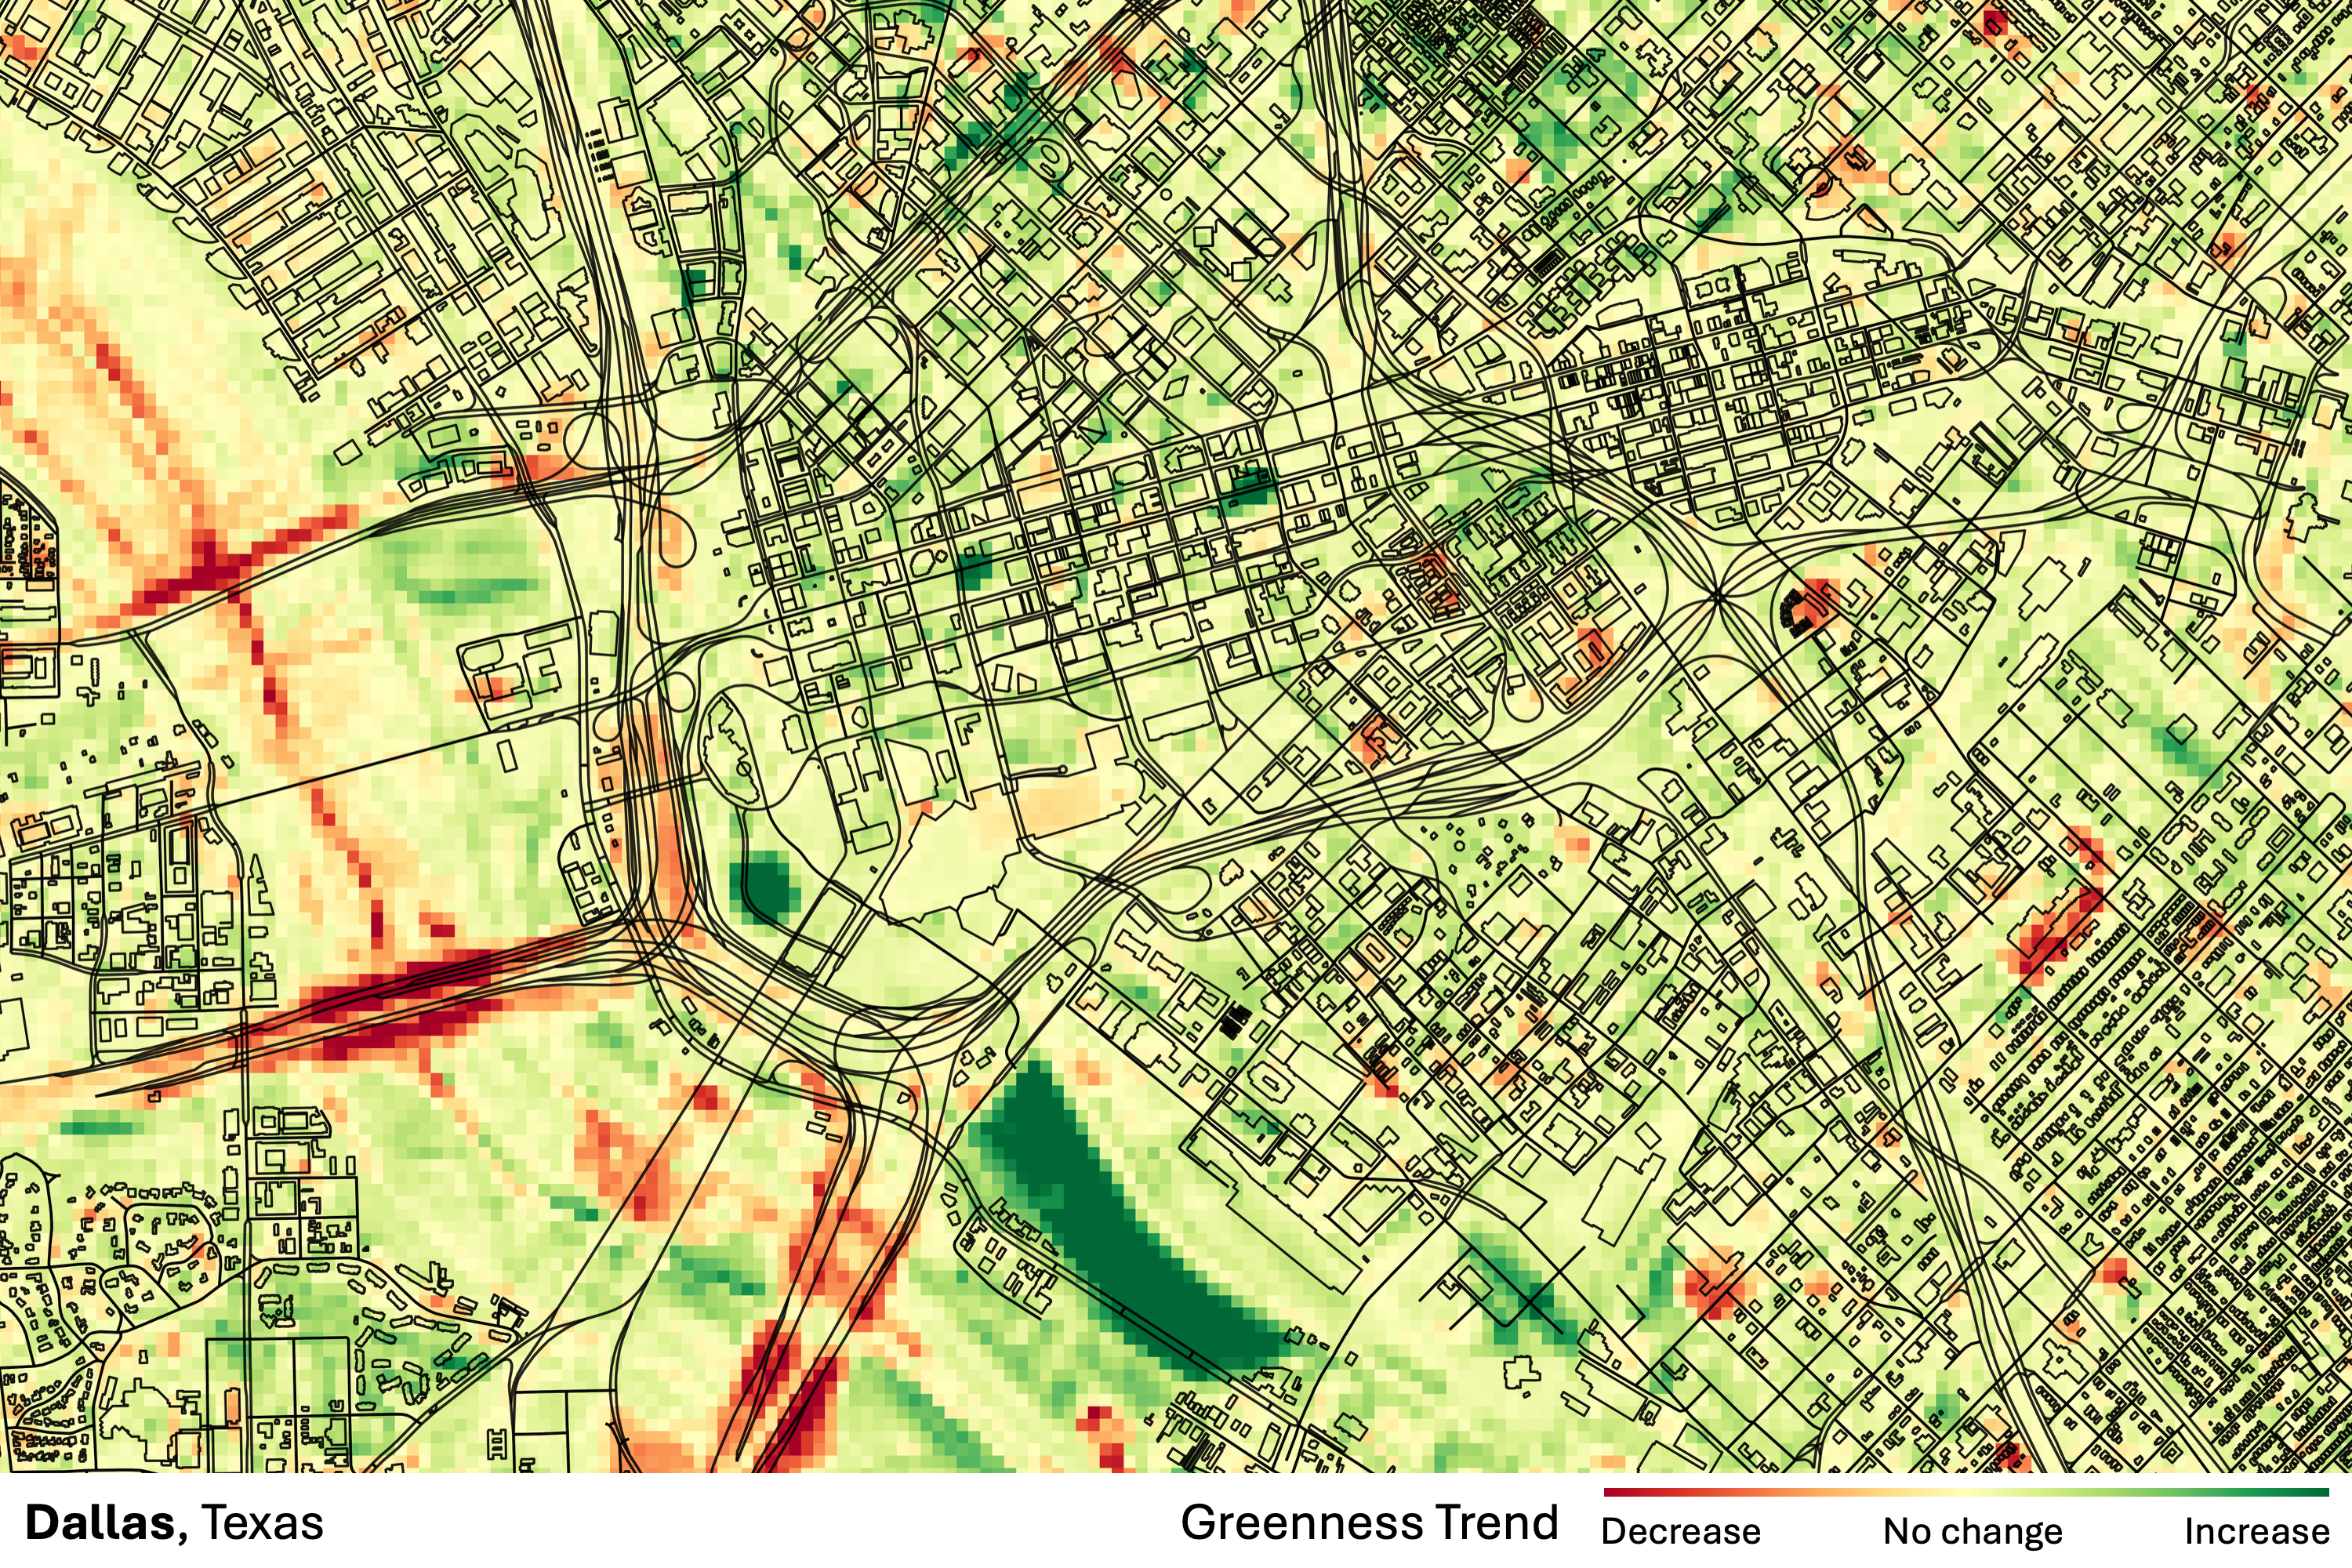
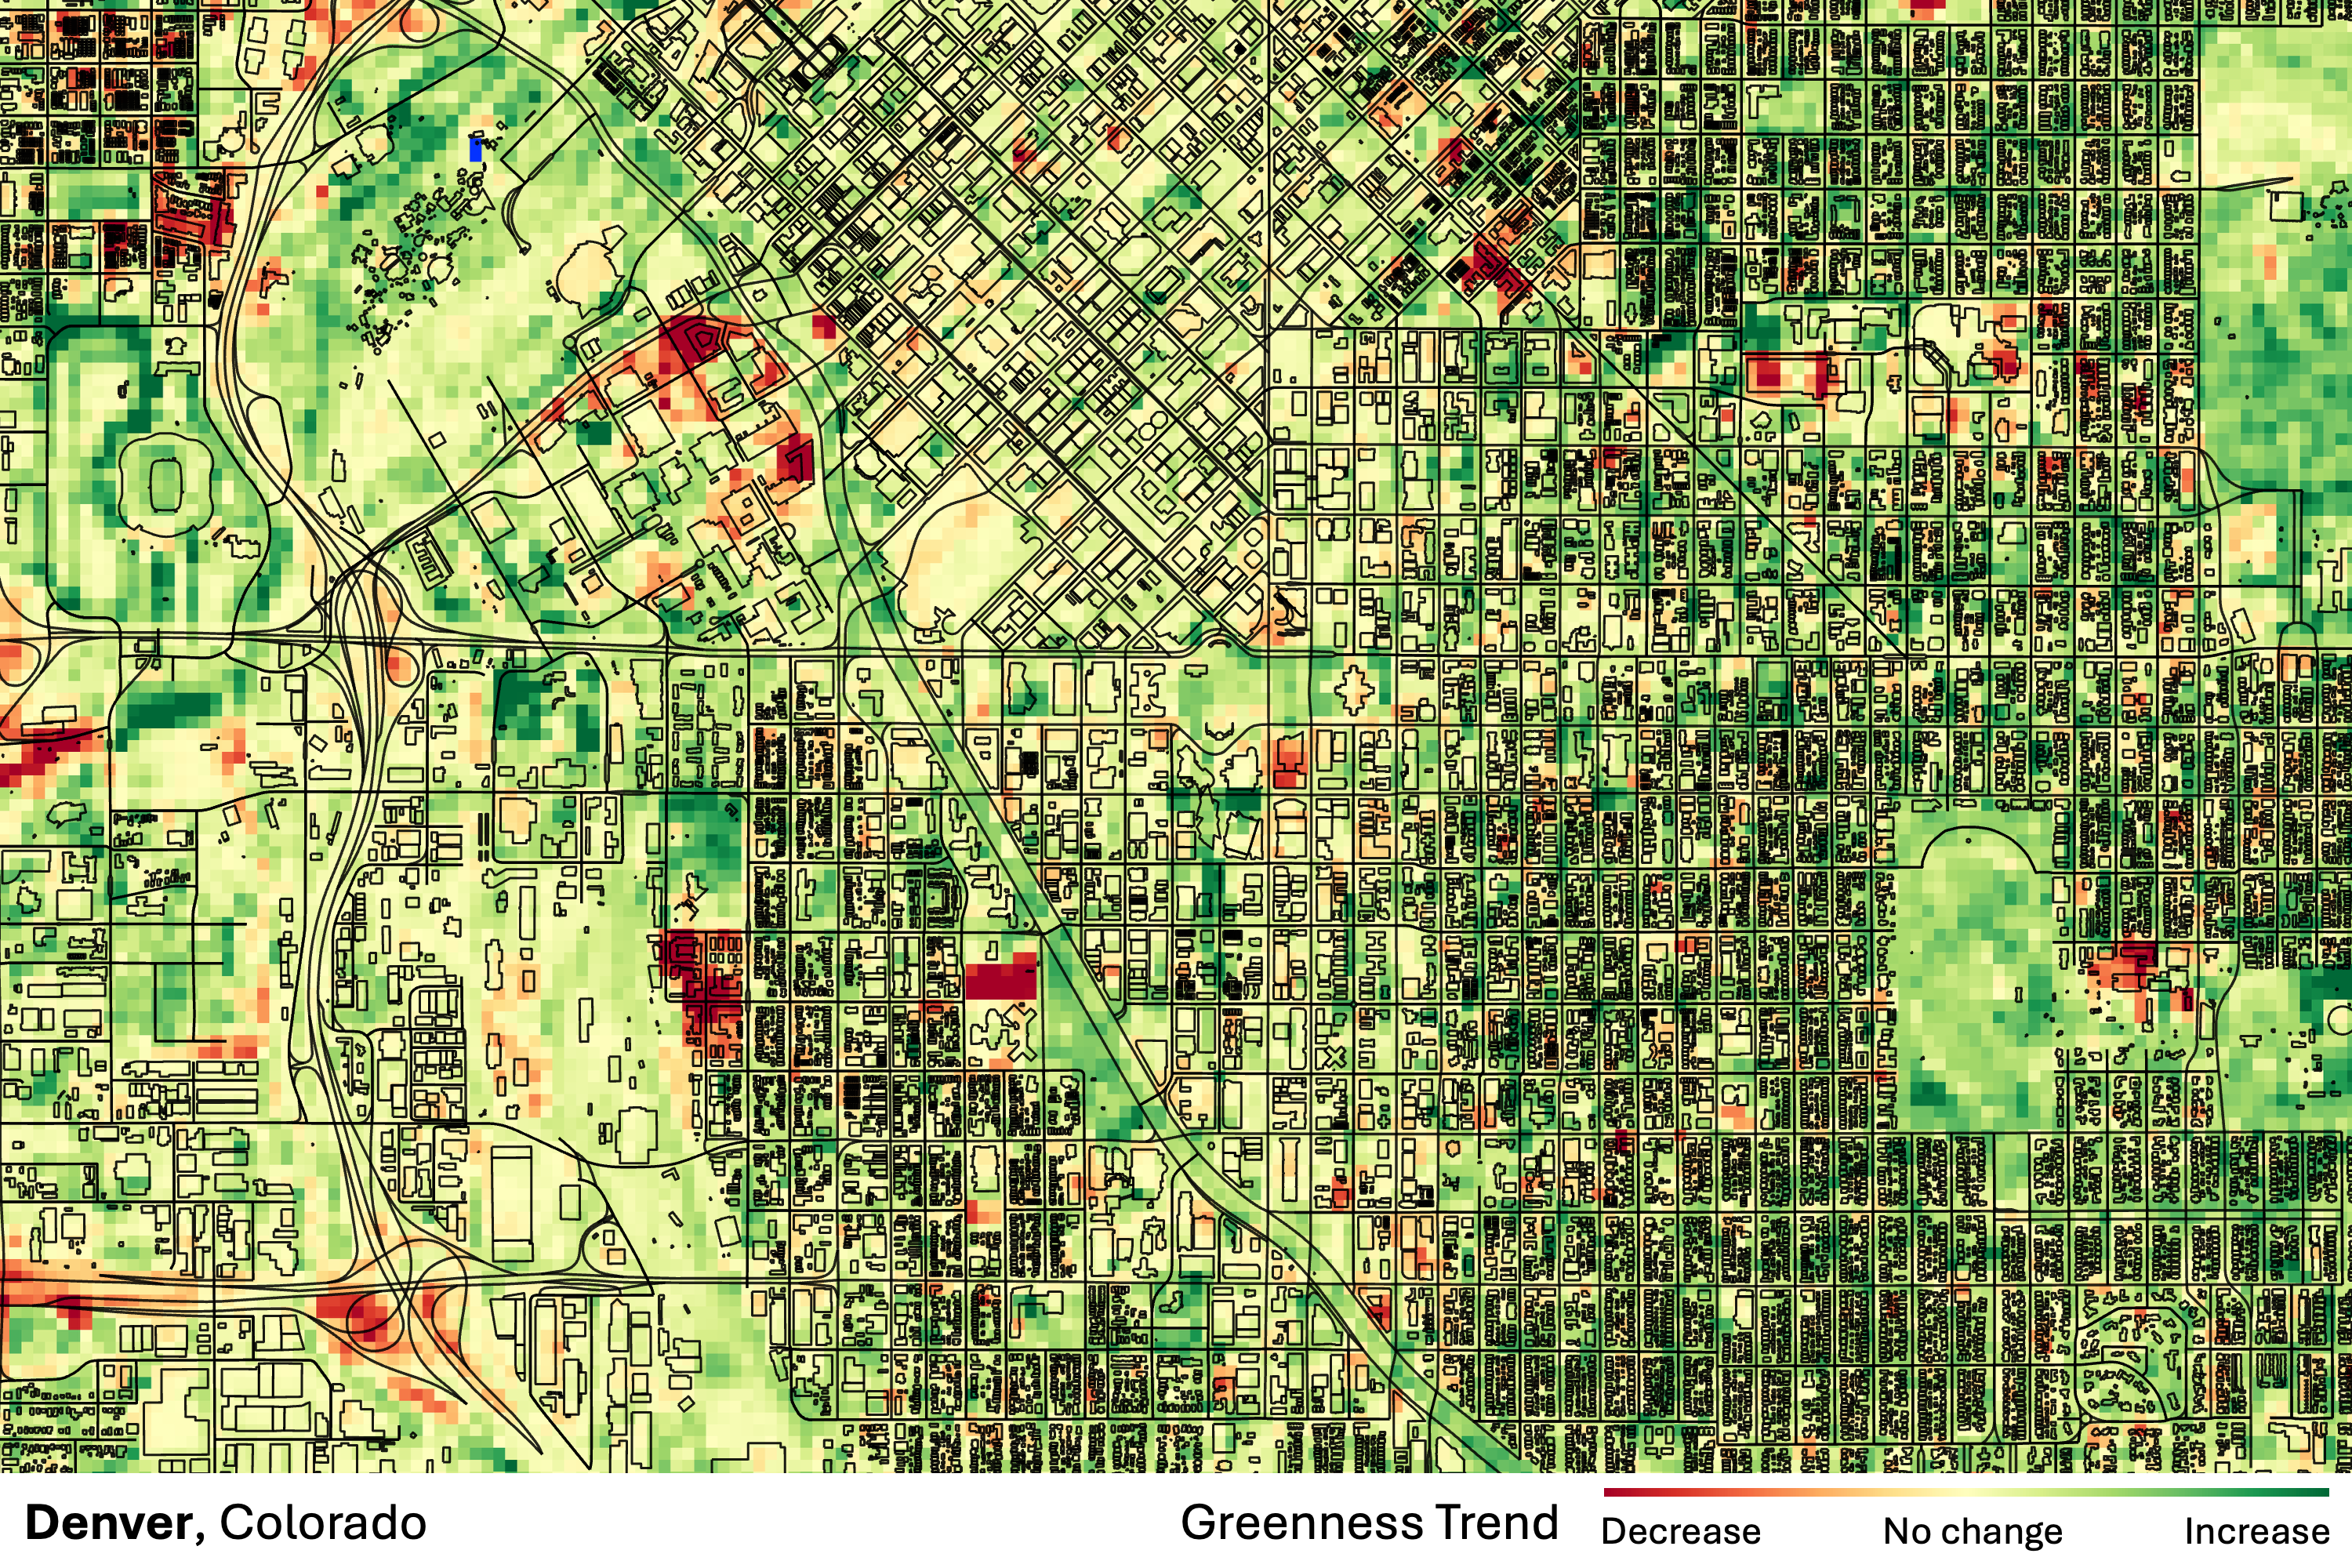
These maps show the net change in vegetation greenness across American cities from 2000 to 2020. Each pixel encodes the Sen's slope of the Normalized Difference Vegetation Index (NDVI) time series, estimated with a Mann-Kendall trend test to account for seasonal weather variability. Green means a pixel got greener over the decade; red means it lost vegetation. Water bodies have been masked out using NDWI.
The NDVI rasters are overlaid with OpenStreetMap road networks and building footprints, pulled via OSMnx and reprojected into the raster's native CRS. The result is a kind of urban portrait: you can read the city's street grid, its parks, its coastline, and see exactly where it gained or lost greenness over ten years.
Click any image to view full resolution.